We take a look at the 4 best metrics for Twitter, so you can stay on top of your Twitter analytics and drive success on the platform.
Share This Post
Share on facebookShare on linkedinShare on twitterShare on email
Subscribe To Weekly Millimetric Newsletter
Effectively using Twitter analytics is critical to driving success on the social media platform. But there are dozens of metrics for Twitter you could be tracking, so finding the right ones for your team and company can be difficult. We’d recommend keeping it simple. So, we’re sharing the 4 best metrics for Twitter analytics, to help you truly understand your audience and supercharge your Twitter presence.
Twitter today
First off, let’s take a quick look at the state-of-play on Twitter today.
- There are 330 million monthly active Twitter accounts
- 500 million Tweets are sent every day
- Twitter is the top platform for discovery, with 79% of people using Twitter to find out what’s new
- People spend 26% more time viewing ads on Twitter
- Twitter’s site referral traffic is up 6%, year-over-year
Twitter is a great platform for attracting new customers and driving brand awareness. But, understanding Twitter analytics and finding the right Twitter metrics is critical to getting the most out of the platform. Here’s the 4 best metrics for Twitter.
The 4 best metrics for Twitter analytics
1. Twitter engagement
Having millions of followers means nothing if they aren’t engaging with your company. This is why Twitter impressions are not an effective metric on their own, you also need to know how much of those impressions led to an engagement.
But, Twitter engagement can be defined as anything from a click to a mention. So you need to decide what engagement is for your company and the goals you are trying to achieve.
Twitter engagement metrics can be the number of:
- Link clicks
- Replies
- Retweets
- Mentions
- Use of branded hashtags
- Links back to you
- Tweet ‘likes’
READ MORE: How to choose marketing KPIs
2. (Engaged) audience growth
One of your Twitter goals is always going to be to grow your audience. So, tracking the number of followers you are gathering is a key Twitter metric.

But, as nice as it is to have a huge following, it’s not enough if they aren’t engaging with your content. So, alongside audience growth, measure the number of engaged followers in your key demographic. That’s followers who are replying to your Tweets, retweeting you and liking your content. With Twitter, it’s about quality, not quantity.
3. Tweet performance by engagement rate
Knowing how well your average Tweet is performing is another key metric for Twitter. Tweet performance lets you know whether your content is engaging for your audience.
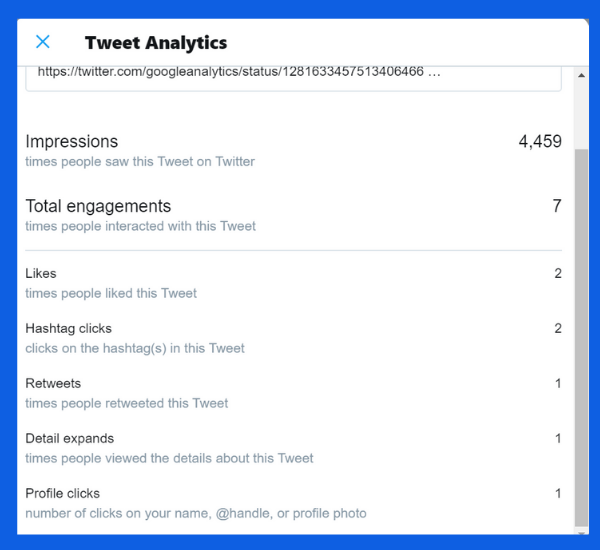
To understand Tweet performance, you need to track your engagement rate, not just impressions. This means looking at the Twitter analytics that break down the Tweet’s performance, underneath every Tweet. This is what it looks like:

The way to calculate engagement rate by percentage is to divide the number of engagements by the number of impressions and multiply that by 100. So, in the case of the Tweet above, this would be:
(7÷4,459) x 100= 0.15% engagement rate
Despite the fact there were a fair amount of impressions on this Tweet, the engagement rate was actually relatively low. While 4,459 people saw it, only 0.15% clicked, so this content wasn’t very engaging for the audience. This is why calculating Twitter engagement rate rather than just going by impressions is critical to fully understanding your presence on the platform.
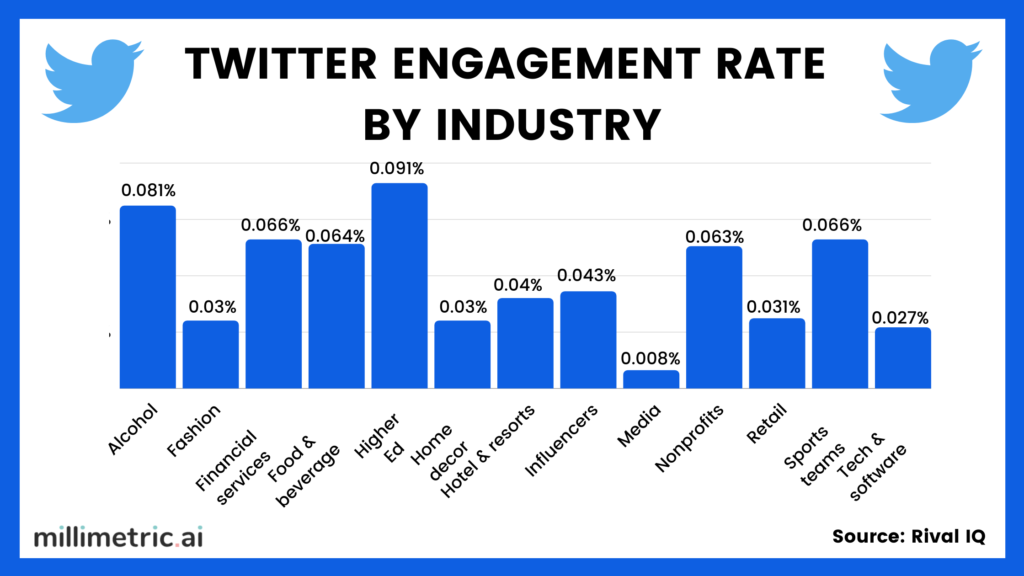
To help you understand your engagement rate better, check out the average engagement rate in your industry:

4. Twitter conversions
This is the Twitter metric that you most definitely want to report on, because it’s the one that gets your department the most kudos! Tracking the number of conversions as a result of your Twitter presence lets you know just how much revenue the platform is adding to your company. This number will be specific to your company and your product.
This is also the only metric we’ve listed that you can’t track using Twitter’s inbuilt analytics. Instead, find this out using Google Analytics or whatever tool you use for monitoring conversions.
Metrics for Twitter: Key takeaways
Much like other key marketing metrics, vanity metrics, like Tweet impressions, might make you look good, but don’t tell you a lot about how strong your Twitter presence actually is. Metrics for Twitter that actually show how engaged followers are and how frequently they are converting are far more helpful at showing you what’s going well, and what needs improving.

Let’s finish up by sharing some quick wins to drive higher engagement on Twitter.
Quick wins for higher engagement on Twitter
Here’s a few ways to improve your Twitter engagement and conversions rates:
- Tweet more frequently – according to Co Schedule, tweeting between 3-7 times a day is optimal. Experiment and see what works best for you
- Post more visual and video content – video content receives 10x more amount of engagement as non-visual content
- Optimise your posting time – try posting at different times throughout the week and make a note of when your audience are most engaged
- Engage with your audience on Twitter
- Use hashtags (up to 3) and research the best ones for your industry and content
READ MORE: Data-driven to madness: What to do when there’s too much data
Subscribe to receive our latest blogs