Where there is data there will always be anomalies. But what is an anomaly? We take a look at what anomalies are in the business world and how to find anomalies in data.
Share This Post
Subscribe To Weekly Millimetric Newsletter
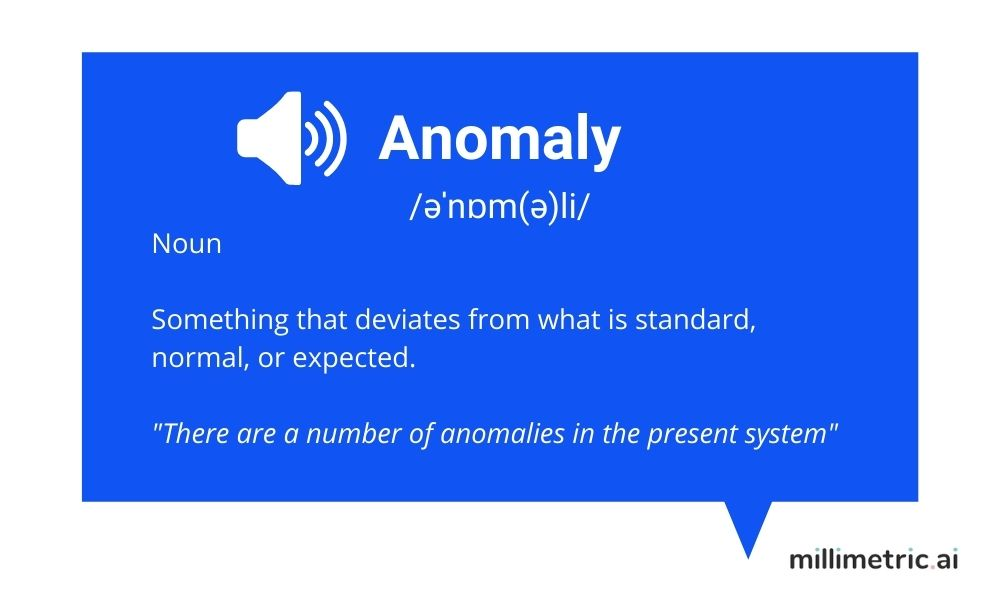
What is an anomaly? An anomaly (also known as an outlier) is when something happens that is outside of the norm, when it stands out or deviates from what is expected.

Put simply, an anomaly is an irregular, or not easily classified, piece of information. It is essentially a piece of data that, for one reason or another, doesn’t fit with the rest of the results. It’s often an indicator of something unexpected or problematic happening.

What is an anomaly in the business world?
In today’s data-driven world, companies can measure pretty much every aspect of business activity, from product performance to customer behaviour. These make up the key performance indicators (KPIs) we use to measure company success, monitor revenue streams and evaluate various business strategies.
There are loads of tools that we use to measure our KPIs: Facebooks Ads and Google Analytics to name just a couple. And as we get better at measuring these KPIs and adding business intelligence tools and data visualisation tools to our tech stacks, these datasets keep getting bigger.
In these datasets there are hundreds of general patterns that indicate ‘business as usual’ – and some numbers that stick out. An anomaly in a data set will generally be a figure that’s higher or lower than expected, for example a recent set of ads that has a click through rate (CTR) half that of the last few campaigns.

An anomaly indicates either that something has gone wrong or that there has been an unexpected result, but not all anomalies are created equal.
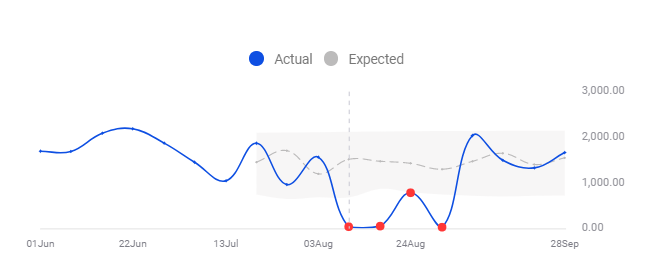
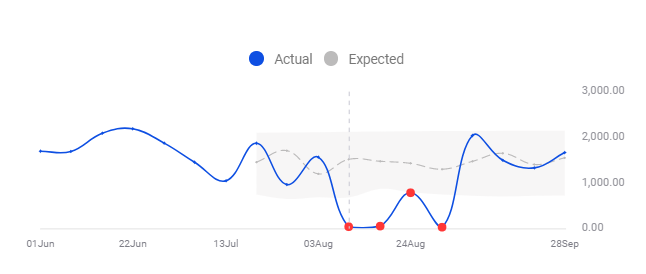
For example, an anomaly might look like this graph, where it’s obvious that there is something going on that’s ‘against the norm’.

An anomaly in average price on the Millimetric anomaly detection platform
Or an anomaly might be a bit harder to spot, like in this graph which shows page loading times, but is harder to distinguish.

An anomaly in average page load time on the Millimetric anomaly detection platform
It might even be almost invisible to the human eye, unless you know exactly what you’re looking for, like in this graph displaying user behaviour which would probably need to be interpreted by a data analyst.

An anomaly invisible to the human eye, as seen on Google Analytics
Whatever the anomaly looks like, it could contain important information that companies need to act on, so it’s crucial businesses have some form of data anomaly detection.
Are anomalies always bad?
Although the word ‘anomaly’ may have negative connotations, it does not necessarily indicate something bad has happened. An anomaly can also mean that something very good has happened – a result better than expected – which has completely skewed the results. Say the ROAS of your latest ad campaign is much better than usual, this would appear in your data as an anomaly, which is actually a sign you’re doing something great.
While in scientific research anomalies are sometimes written off when they don’t fit the general trend, in business you can’t just choose to ignore anomalies that don’t fit your goals. All issues within data, good or bad, need to be detected and taken a note of so you can learn what issues are present or what is working particularly well and needs to be replicated.

Let’s have a look at some real-world examples of anomalies in business KPIs.
What is an anomaly in e-commerce?
Here are a few examples what anomalies look like in ecommerce:
- A change in acquisition costs, for example a higher-than-normal cost per acquisition (CPA)
- Unusually high page loading times
- A revenue peak in a specific city
- A change in engagement with online ads, for example a higher CTR rate than normal
- Costing and product errors
- Technical front end problems causing a decrease in the add to cart rate
READ MORE: What are the most common anomalies in ecommerce?

What is an anomaly in digital marketing?
Here are a few examples what anomalies look like in digital marketing:
- An increase in the cost per click (CPC) of a campaign
- A lower CTR than usual
- A change in the SEO performance of your webpages
- A target audience or area performing significantly better or worse than normal
- Unusually low visitors to a web page, suggesting something has broken
How can AI and machine learning help the process of anomaly detection?
Of course, it’s not always possible for one person alone to detect all the anomalies across a business’ KPIs. Humans don’t always have the time, training and resources to number crunch day in, day out to detect anomalies across various datasets. And dashboards and visualisation tools like Google alerts can only take you so far.
But with AI and machine learning, the number crunching can happen automatically in a fraction of the time. AI anomaly detection can analyse and make sense of vast strings of data 24/7 and let us know immediately when there’s an anomaly in KPIs, before it causes further problems.

AI anomaly detection was once something that was only available to huge tech companies able to invest millions and have hundreds of data analysts on the case.
But we’ve built AI anomaly detection software that’s for everyone.
Millimetric’s AI platform can analyse thousands of metrics in real time and automatically let you know when an anomaly is detected to enable you to take action straight away before it impacts your KPIs and bottom line.

Try the software for free today and empower your team to know exactly when, where and why unusual activity in your metrics occurs.
Subscribe to receive our latest blogs